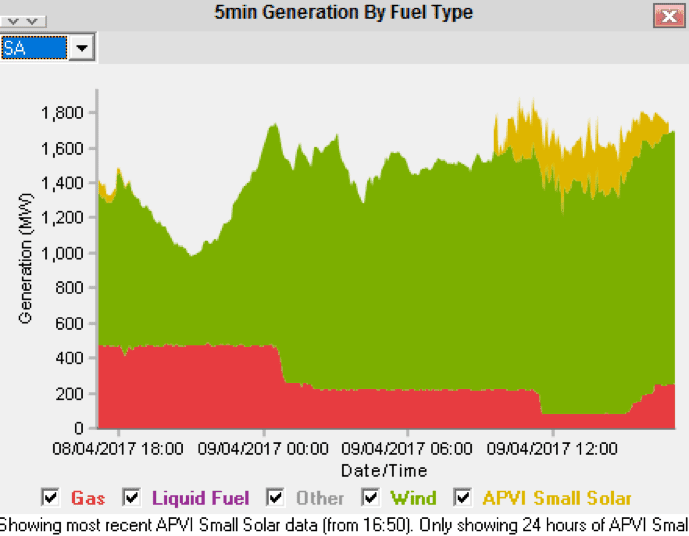
Figure 1 A good day for wind & PV in South Australia, but just a day. Source: Global Roam NEM Watch
Figure 1 A good day for wind & PV in South Australia, but just a day. Source: Global Roam NEM Watch
There have probably been lots of times in the past when renewables have completely dominated South Australia, but they don’t spring to mind. The addition of 150 MW of Hornsdale together with the AEMO formally recording the estimated rooftop PV output means that on Sunday we saw that for a couple of hours renewables were about 15/16 of South Australian generation and something like 70% of the total over the day.
In Victoria, if we compare the first 9 days of April with PCP what we see is that gas is largely picking up the lost Hazelwood load.
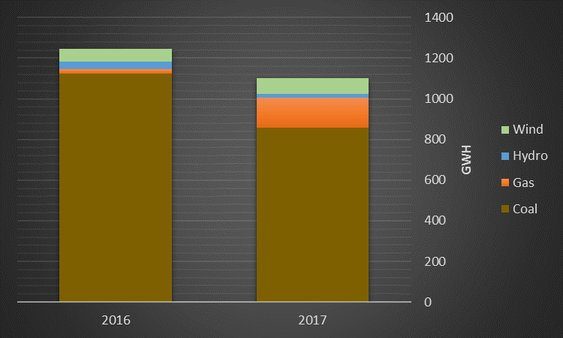
Figure 2 Generation in Victoria 1-9 April 2017 & 2016. Source: NEM Review
Most of that increased gas fueled electricity is coming from ORG’s Mortlake Station. That’s an open cycle station ie its burning about 11.25 GJ gas per MWh. In addition, gas fired electricity suffers from both a decline in output over time so in general they mostly don’t run all the time. Maintenance is also based on the number of starts. If ORG was paying $9 GJ for gas, and it’s not, it would be costing over $110/MWh to run the power station.

Figure 3 Mortlake output since Hazelwood closed. Source: NEM Review
What this means is that for ORG, the forthcoming sale of Loy Yang B with its 1000 MW capacity is a matter of some considerable interest. Although ORG’s avowed “cleaner energy” policy may prevent them from directly bidding for LYB they will be likely to offer any other buyer some contractual assistance in the form of a PPA. Still, whoever buys that station will bear the risk of future carbon policy change, emission intensity scheme and the new supply coming from Victoria’s renewable energy policy.
Another side effect of the closure of Hazelwood is to increase the opportunity of wind exports from South Australia to Victoria. In 3 out of 9 days in April South Australia has been a net exporter of electricity and the extra export opportunity has resulted in better average prices. South Australia wind has achieved an average of $63 MWh in the first 9 days of April. If you have some unhedged capacity and you are getting $145 for your black and green energy you can probably colour your afternoon gin pink.
Volumes. In the week to April 7 were well down on last year, 6% across the NEM with every State down, led by Queensland down 10%. Although sharply lower temperatures in Sydney and Brisbane are part of the explanation we also think that the floods in Qld have impacted electricity demand.

Figure 4: Summary

Figure 5 Selected utility share prices.
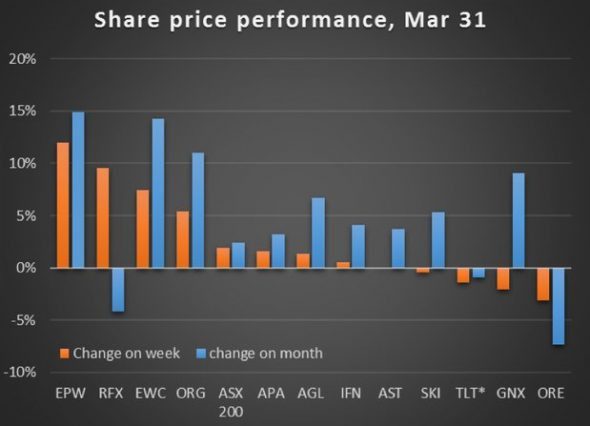
Figure 6: Weekly and monthly share price performance
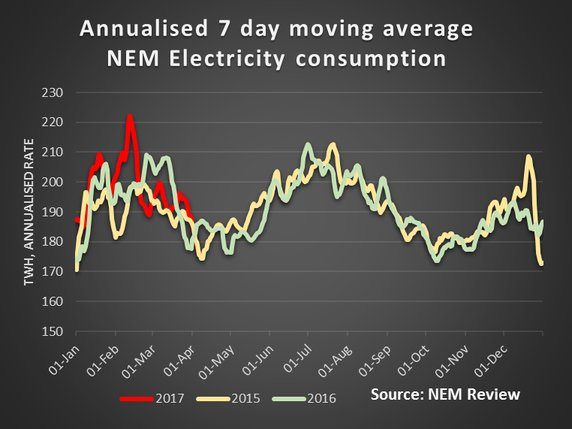
Figure 7: electricity volumes
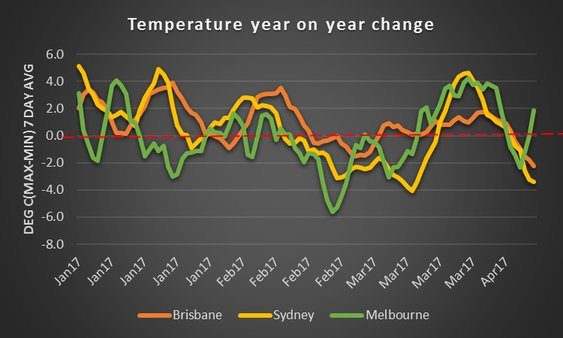
Figure 8: 7 Day moving avg year on year temp change. Source: BOM


Figure 13: Baseload futures financial year time weighted average

Figure 14: STTM gas prices
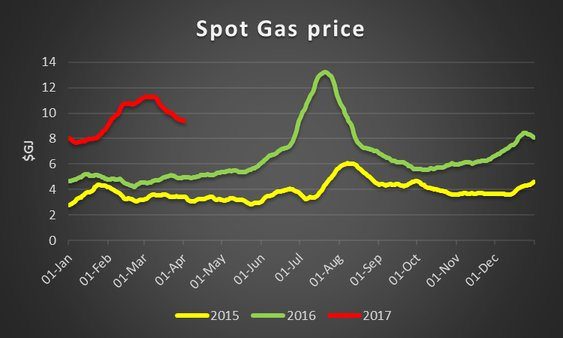
Figure 15 30 day moving average of Adelaide, Brisbane, Sydney STTM price. Source: AEMO
David Leitch is principal of ITK. He was formerly a Utility Analyst for leading investment banks over the past 30 years. The views expressed are his own. Please note our new section, Energy Markets, which will include analysis from Leitch on the energy markets and broader energy issues. And also note our live generation widget, and the APVI solar contribution.