In Lady Windermere’s Fan, Oscar Wilde has Lord Darlington describe a cynic as a man who knows the price of everything but the value of nothing.
If we used electricity prices as a measure, we exhibit a healthy lack of cynicism: my guess is 9 out of 10 people reading this will not know if the price they pay is closer to 20 cents per kWh or 40 cents per kWh.
But they will have a keen sense of the value of it: even if it were far more expensive than it is, they would still buy it, or make it themselves.
For many goods and services, it is not necessary for customers to have a good knowledge of prices in order to buy well: sellers have an incentive to promote their wares and it is often easy for customers to compare and make informed decisions.
Not so retail electricity. Here is a market where customers need to engage actively in order to buy well. Such engagement requires consistent effort and a high level of skill.
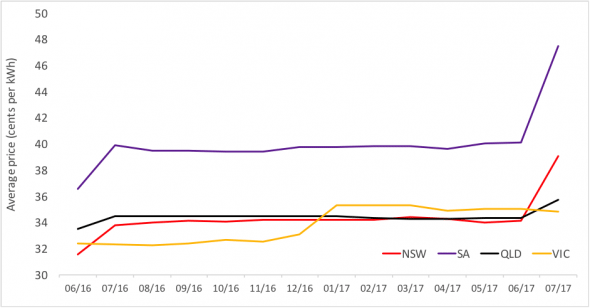
In this context and in response to requests from many quarters for information on electricity prices, we have assembled a price series, the “MarkIntell Major Retailer Residential Electricity Price Series” (see chart below), that will help to inform buyers of “typical” prices and it may also be useful to policy makers, regulators, advocates and the industry.
The series is based on a weighted average of the median offers of the Big Three retailers (AGL, Origin and Energy Australia) in the four states with deregulated residential prices.
These three retailers supply about 70% of customers in Victoria, 85% in South Australia and 90% in New South Wales and Queensland. You can see the details of the calculation of the series on page 1 which is available on Reneweconomy and also on www.markintell.com.au and www.cmeaustralia.com.au.
The series will be updated monthly and put on these sites.
It merits noting that in this series the estimate of the electricity price paid by a typical household in Victoria is 21% higher than the Australian Energy Market Commission (AEMC) estimates for market offers in its annual retail price trends report.
We have not benchmarked the AEMC’s price estimates against ours for the other states, but we suspect the gap is likely to be even larger in these other states.
It seems that a reason for the difference between the prices in our monthly series and the AEMC’s annual price trends is that the AEMC assumes all households on market offers pay their retailers’ cheapest rate.
We think a “typical” residential customer is likely to be paying closer to the median offer from their retailer – only those that have recently switched are likely to pay the cheapest rates available.
Typically less than 1 in 8 households will switch retailers each year (fewer outside Victoria) and we suspect this switching rate is not uniform – a small cohort of customers are engaged and switch more frequently than the vast majority.
It also merits mention that the distribution of consumption across the residential sector is skewed – there are more consumers that use less electricity than the average than there are that use more than the average.
In this price series, for the purpose of consistent inter-state comparison we have assumed 4,800 kWh per year.
Many households consume considerably less than this and in those areas with high fixed charges – Victoria and country New South Wales in particular – the existence of high fixed charges translate into much higher average prices for these customers than those shown in this price series.
There is a great deal more to be said about retail electricity prices and in regulatory and policy circles the subject is now “trending”. Not a moment too soon.
Perhaps this price series will come to be seen as a useful barometer of the market.
Bruce Mountain is the Director of consultancy Carbon and Energy Markets and co-founder of energy retail market data and intelligence provider, MarkIntell.